Orbital Predictor for Earth Observation - Design and Features

My second post on Orbital Predictor starts off by giving an overview of the design of the application. It then goes into more detail on the different features and some examples on how they can be used.
Design
Orbital Predictor was developed using the Django web framework. This handles all the basic requirements related to running a web application, such as routing urls, updating the database and generating html to display to the user. The back end uses the python packages sgp4.py and PyEphem for carrying out orbital predictions, as well as a custom python package I wrote for generating CZML files to visualize satellites orbits, which uses czml-py.
The front end was styled using Bootstrap, Cesium was used as the digital globe for visualizing orbits and the Cesium API was used for performing geometric calculations when checking for an intersection of the satellites footprint and the area of interest. SQLite database was used to store satellite information, such as onboard instruments, and the TLE used to describe their orbits, as well as user accounts and a history of queries made.
The API was developed using a REST based methodology, and the addition of Django view methods to receive the requests. This allows users to make a request to the application from a language or framework of their choosing, as long as the request is in the correct format. Git was used for source version control, and GitHub to store the repository. Python-Anywhere was used to host the site online, while the domain name was purchased from GoDaddy.
Features
The main features of Orbital Predictor are:- Orbit Visualisation
- Overpass Prediction
- Add Satellite
- API
Orbit Visualisation
To run an orbit visualisation query, the user selects the satellites, chooses the date and time range over which they want to visualize the orbits and then clicks the Show Orbits button. This will generate a CZML file in the back end, which is used by Cesium to display the orbits.

Overpass Queries
Overpass queries are the main features of the application. These are for when a user has a location which they would like to observe, and they want to know which satellites, with which instruments, will be in a position to overpass that area. There are 3 types of overpass queries, which are selected using the radio buttons in the right column. Each of the three queries require the user to:
- Select the satellites they are interested in
- Select the time and date range for the query (date ranges of 1-2 days are recommended)
- Select the ground location they would like to observe, using either the Select Location or Select Polygon tool bar buttons, or by manually entering the coordinates
Within Instrument Swath
This query returns the satellites whose onboard instruments footprint intersects with the area of interest during the queries specified time frame. When the overpass is visualized in Cesium, the footprint is displayed using a green cone. This is more restrictive than the All Passes query, as the instruments footprint is much smaller than the "visible" footprint of the satellite, which is the area on the ground from where the satellite would be visible to an observer. This query would be useful for scientists trying to plan an Earth observation campaign for a speciffc area of the Earth.
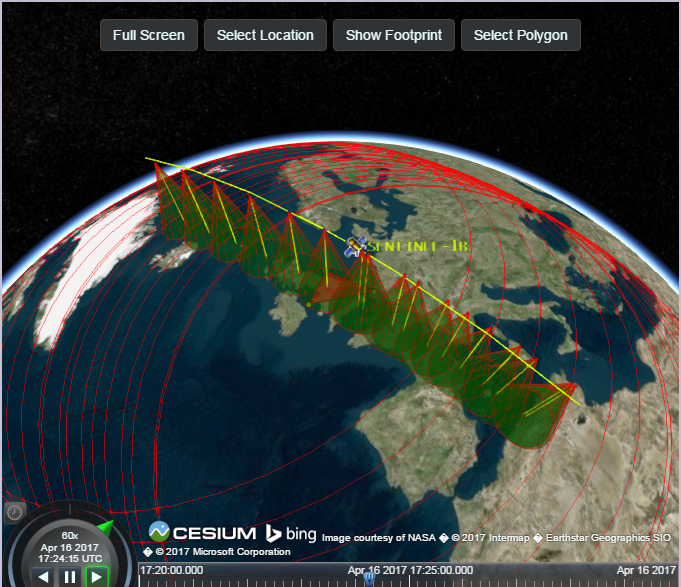
All Passes
This query returns the satellites which overpasses an area such that an observer on the ground would have a direct line of sight to the satellite. When visualising the orbit in Cesium, the area for which this query is valid is displayed using a red circle. This query is the least restrictive of the 3, and would be useful for amateur radio operators, wishing to know when they are in range of a satellite.

Visible Passes Only
This is a more restrictive version of All Passes, in that it only returns the passes which are at a time of day such that they would be visible to the naked eye. This is usually just after dusk, or just before dawn, when the observer on the ground is in darkness, but the satellite is still lit up by the sun. This would be useful for hobbyists wishing to observe the International Space Station crossing the night sky. This feature is complentary to Heavens Above, which lists upcoming overpasses for all satellites.
Add Satellite
Users can add their own custom satellite to the database. This would be useful for users wishing to understand the Two Line Element format used to encode a satellites orbit, as they can experiment with different parameters and then visualise the resulting orbit.
To add a custom satellite, the user clicks on the Home button in the top menu bar to reload the page, then in the bottom right of the screen, they can fill in the name and TLE of the satellite they wish to add, as well as the instrument name and swath width. The swath width is what defines the instruments field of view/footprint. The TLE must be in the correct format as specified in this Celestrak article. The satellite number, which is the 5 digit number at the start of the first and second line of the TLE, must be unique. Users have to create an account and be logged in to use this feature.
API
The Orbital Predictor API allows users to run orbit prediction or overpass queries from their own programs.Orbit Prediction
The orbit prediction API query generates CZML data, which defines the orbit of a list of satellites, in a specified date range. The user can use this for their own program, or to visualize the orbit by saving the returned data in a .czml file and then dragging and dropping the file into Cesium Viewer.
Overpass
They can also use the API to make an overpass query. This returns a JSON encoded list of satellites which overpass the specified area, along with some more detailed information, such as the overpass duration and the rise and set time of each overpass.
An example of both types of API call can be found here.
Run Previous Queries
Users can register by clicking the Create Account button in the top right of the screen. Then when they are logged in, all their queries are stored in the database. To see a list of previous queries they have made, they can click on their user name in the top menu bar, which will display the old queries in the bottom right area of the screen. They can then click on each query to see its results.
Summary
That's it for this post, hopefully this gives a good overview of the design and features of the Orbital Predictor. Since it was developed, I've yet to make any major changes, but I am hoping to do a big update to the UI/UX soon. Future posts will also go into more detail, including code samples, on how the application does the following:
- Orbit Prediction
- Satellite Instrument Field of View Generation
- Overpass Prediction
- CZML Generation from Satellite TLE

i hope ur post would be the only one on the topic yet online, there is no post which explains as how to get convert the keplerian elements into a czml file using any library.
ReplyDeleteplz do that soon, i hope u all the best
Thank you for providing these details.cyber security training london
ReplyDelete